2. Monitored
2.1. Machine Info

<<<<<<< HEAD
2.2. Recon
nmap
ssh
ldap
http, https
PORT     STATE SERVICE    VERSION
22/tcp   open  ssh        OpenSSH 8.4p1 Debian 5+deb11u3 (protocol 2.0)
| ssh-hostkey:
|   3072 61:e2:e7:b4:1b:5d:46:dc:3b:2f:91:38:e6:6d:c5:ff (RSA)
|   256 29:73:c5:a5:8d:aa:3f:60:a9:4a:a3:e5:9f:67:5c:93 (ECDSA)
|_  256 6d:7a:f9:eb:8e:45:c2:02:6a:d5:8d:4d:b3:a3:37:6f (ED25519)
80/tcp   open  http       Apache httpd 2.4.56
|_http-server-header: Apache/2.4.56 (Debian)
|_http-title: Did not follow redirect to https://nagios.monitored.htb/
389/tcp  open  ldap       OpenLDAP 2.2.X - 2.3.X
443/tcp  open  ssl/http   Apache httpd 2.4.56 ((Debian))
| tls-alpn:
|_  http/1.1
| ssl-cert: Subject: commonName=nagios.monitored.htb/organizationName=Monitored/stateOrProvinceName=Dorset/countryName=UK
| Not valid before: 2023-11-11T21:46:55
|_Not valid after:  2297-08-25T21:46:55
|_http-server-header: Apache/2.4.56 (Debian)
|_http-title: Nagios XI
|_ssl-date: TLS randomness does not represent time
5667/tcp open  tcpwrapped
Warning: OSScan results may be unreliable because we could not find at least 1 open and 1 closed port
Aggressive OS guesses: Linux 5.0 (96%), Linux 4.15 - 5.8 (96%), Linux 5.3 - 5.4 (95%), Linux 2.6.32 (95%), Linux 5.0 - 5.5 (95%), Linux 3.1 (95%), Linux 3.2 (95%), AXIS 210A or 211 Network Camera (Linux 2.6.17) (95%), ASUS RT-N56U WAP (Linux 3.4) (93%), Linux 3.16 (93%)
No exact OS matches for host (test conditions non-ideal).
Network Distance: 2 hops
Service Info: Host: nagios.monitored.htb; OS: Linux; CPE: cpe:/o:linux:linux_kernel
path
$ gobuster dir -u https://nagios.monitored.htb -w /usr/share/seclists/Discovery/Web-Content/directory-list-2.3-medium.txt -x php -t 64 --no-error -k
===============================================================
Gobuster v3.6
by OJ Reeves (@TheColonial) & Christian Mehlmauer (@firefart)
===============================================================
[+] Url:                     https://nagios.monitored.htb
[+] Method:                  GET
[+] Threads:                 64
[+] Wordlist:                /usr/share/seclists/Discovery/Web-Content/directory-list-2.3-medium.txt
[+] Negative Status codes:   404
[+] User Agent:              gobuster/3.6
[+] Extensions:              php
[+] Timeout:                 10s
===============================================================
Starting gobuster in directory enumeration mode
===============================================================
/.php                 (Status: 403) [Size: 286]
/index.php            (Status: 200) [Size: 3245]
/javascript           (Status: 301) [Size: 335] [--> https://nagios.monitored.htb/javascript/]
/nagios               (Status: 401) [Size: 468]
/.php                 (Status: 403) [Size: 286]
/server-status        (Status: 403) [Size: 286]
Progress: 441120 / 441122 (100.00%)
===============================================================
Finished
===============================================================
https recon -> Nagios® XI™
default: nagiosadmin:nagiosadmin [x]
no version -> no cred
Nagios® XI™ Copyright © 2008-2024 Nagios Enterprises, LLC. All rights reserved.

msf6 auxiliary(scanner/http/nagios_xi_scanner) > run

[!] No credentials provided. Attempting to obtain the Nagios XI version from the login page. This will not work for newer versions.
[-] 10.10.11.248:443 - Unable to obtain Nagios XI version from the login page.
[!] Please provide a valid Nagios XI USERNAME and PASSWORD, or a specific VERSION to check
[*] Scanned 1 of 1 hosts (100% complete)
[*] Auxiliary module execution completed
udp recon -> snmp service
$ cat nmap/udp.nmap
Nmap scan report for 10.10.11.248
Host is up (0.071s latency).

PORT      STATE         SERVICE
53/udp    closed        domain
67/udp    closed        dhcps
68/udp    open|filtered dhcpc
69/udp    closed        tftp
123/udp   open          ntp
135/udp   closed        msrpc
137/udp   closed        netbios-ns
138/udp   open|filtered netbios-dgm
139/udp   closed        netbios-ssn
161/udp   open          snmp
162/udp   open|filtered snmptrap
445/udp   closed        microsoft-ds
500/udp   closed        isakmp
514/udp   closed        syslog
520/udp   closed        route
631/udp   closed        ipp
1434/udp  closed        ms-sql-m
1900/udp  closed        upnp
4500/udp  open|filtered nat-t-ike
49152/udp closed        unknown
ldap recon
$ nmap -p 389 --script ldap-search,ldap-rootdse monitored.htb
Nmap scan report for monitored.htb (10.10.11.248)
Host is up (0.057s latency).

PORT    STATE SERVICE
389/tcp open  ldap
| ldap-search:
|   Context: dc=monitored,dc=htb
|     dn: dc=monitored,dc=htb
|         objectClass: top
|         objectClass: dcObject
|         objectClass: organization
|         o: monitored.htb
|_        dc: monitored
| ldap-rootdse:
| LDAP Results
|   <ROOT>
|       namingContexts: dc=monitored,dc=htb
|       supportedControl: 2.16.840.1.113730.3.4.18
|       supportedControl: 2.16.840.1.113730.3.4.2
|       supportedControl: 1.3.6.1.4.1.4203.1.10.1
|       supportedControl: 1.3.6.1.1.22
|       supportedControl: 1.2.840.113556.1.4.319
|       supportedControl: 1.2.826.0.1.3344810.2.3
|       supportedControl: 1.3.6.1.1.13.2
|       supportedControl: 1.3.6.1.1.13.1
|       supportedControl: 1.3.6.1.1.12
|       supportedExtension: 1.3.6.1.4.1.4203.1.11.1
|       supportedExtension: 1.3.6.1.4.1.4203.1.11.3
|       supportedExtension: 1.3.6.1.1.8
|       supportedLDAPVersion: 3
|       supportedSASLMechanisms: DIGEST-MD5
|       supportedSASLMechanisms: NTLM
|       supportedSASLMechanisms: CRAM-MD5
|_      subschemaSubentry: cn=Subschema
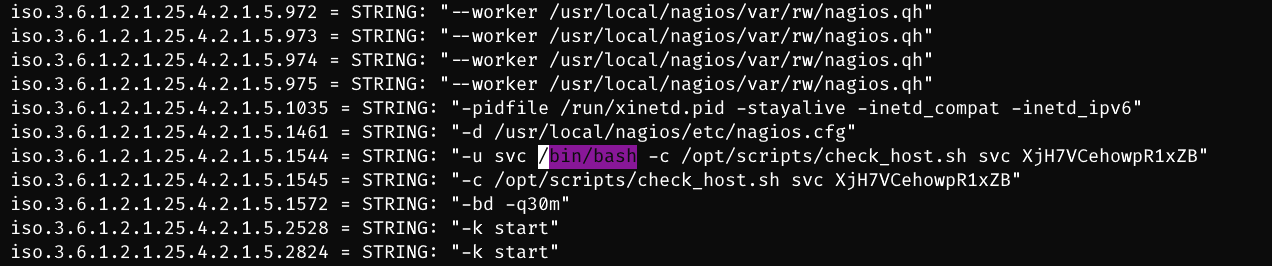
snmp recon
$ snmpwalk -v2c -c public 10.10.11.248
iso.3.6.1.2.1.1.1.0 = STRING: "Linux monitored 5.10.0-27-amd64 #1 SMP Debian 5.10.205-2 (2023-12-31) x86_64"
iso.3.6.1.2.1.1.2.0 = OID: iso.3.6.1.4.1.8072.3.2.10
iso.3.6.1.2.1.1.3.0 = Timeticks: (82051) 0:13:40.51
iso.3.6.1.2.1.1.4.0 = STRING: "Me <root@monitored.htb>"
iso.3.6.1.2.1.1.5.0 = STRING: "monitored"
iso.3.6.1.2.1.1.6.0 = STRING: "Sitting on the Dock of the Bay"
iso.3.6.1.2.1.1.7.0 = INTEGER: 72
iso.3.6.1.2.1.1.8.0 = Timeticks: (1603) 0:00:16.03
iso.3.6.1.2.1.1.9.1.2.1 = OID: iso.3.6.1.6.3.10.3.1.1
iso.3.6.1.2.1.1.9.1.2.2 = OID: iso.3.6.1.6.3.11.3.1.1
iso.3.6.1.2.1.1.9.1.2.3 = OID: iso.3.6.1.6.3.15.2.1.1
iso.3.6.1.2.1.1.9.1.2.4 = OID: iso.3.6.1.6.3.1
iso.3.6.1.2.1.1.9.1.2.5 = OID: iso.3.6.1.6.3.16.2.2.1
iso.3.6.1.2.1.1.9.1.2.6 = OID: iso.3.6.1.2.1.49
iso.3.6.1.2.1.1.9.1.2.7 = OID: iso.3.6.1.2.1.50
iso.3.6.1.2.1.1.9.1.2.8 = OID: iso.3.6.1.2.1.4
iso.3.6.1.2.1.1.9.1.2.9 = OID: iso.3.6.1.6.3.13.3.1.3
iso.3.6.1.2.1.1.9.1.2.10 = OID: iso.3.6.1.2.1.92
iso.3.6.1.2.1.1.9.1.2.11 = OID: iso.3.6.1.2.1.92
iso.3.6.1.2.1.1.9.1.3.1 = STRING: "The SNMP Management Architecture MIB."
iso.3.6.1.2.1.1.9.1.3.2 = STRING: "The MIB for Message Processing and Dispatching."
iso.3.6.1.2.1.1.9.1.3.3 = STRING: "The management information definitions for the SNMP User-based Security Model."
iso.3.6.1.2.1.1.9.1.3.4 = STRING: "The MIB module for SNMPv2 entities"
iso.3.6.1.2.1.1.9.1.3.5 = STRING: "View-based Access Control Model for SNMP."
iso.3.6.1.2.1.1.9.1.3.6 = STRING: "The MIB module for managing TCP implementations"
iso.3.6.1.2.1.1.9.1.3.7 = STRING: "The MIB module for managing UDP implementations"
iso.3.6.1.2.1.1.9.1.3.8 = STRING: "The MIB module for managing IP and ICMP implementations"
iso.3.6.1.2.1.1.9.1.3.9 = STRING: "The MIB modules for managing SNMP Notification, plus filtering."
iso.3.6.1.2.1.1.9.1.3.10 = STRING: "The MIB module for logging SNMP Notifications."
iso.3.6.1.2.1.1.9.1.3.11 = STRING: "The MIB module for logging SNMP Notifications."
iso.3.6.1.2.1.1.9.1.4.1 = Timeticks: (2) 0:00:00.02
iso.3.6.1.2.1.1.9.1.4.2 = Timeticks: (2) 0:00:00.02
$ snmpwalk -v2c -c public -m ALL 10.10.11.248
2.3. Foothold
=======
38e3e6a ([+] Add season4 machine info.)
Notice: the full version of write-up is here.
2.4. Exploit Chain
port scan -> ldap recon -> snmp recon -> cred leakage -> login using backend api to gain ticket auth_token -> CVE-2023-40931 Authenticated SQLi -> admin api key -> create a new admin-priv user using backend api -> login nagios xi admin page -> create a rshell command and execute it -> user shell -> sudo -l -> npcd serivce file is writable and sudo executable -> stop npcd -> fake a new elf with rshell code -> start npcd service -> root shell